Summary
- Droughts in Australia and New Zealand have caused more milk demand that is increasing cheese prices.
- European cheese tariffs threaten Kraft Heinz’s profit margins even more.
- Negative growth, volatile earnings, and worrisome fundamentals reveal the risks of this company.
- Valuation analysis shows that this company is overpriced.
- Looking for a helping hand in the market? Members of Good Stocks@Bargain Prices get exclusive ideas and guidance to navigate any climate. Get started today »
The Kraft Heinz Company (KHC) combines two iconic American companies that would seem to have all the ingredients to make a great investment. While the brand names still convey value, this article reveals the worrisome fundamentals and current threats that this company faces. By the end of the article, it may have you convinced to run away from this investment. A stock valuation analysis also supports this thesis.
In this article, we will dig deeper into the fundamentals of this company, and you will clearly see the strengths and weaknesses of this iconic food processing stock.
Snapshot of the Company
A fast way for me to get an overall understanding of the condition of the business is to use the BTMA Stock Analyzer’s company rating analysis. However, there is not enough data to produce a definitive score. This is because the merger between the companies took place around 2015 and the BTMA Stock Analyzer requires 10 years of solid company history to provide a definitive company rating score. There is not enough data for 10 Year Price Per Share, and Ability to Recover from a Market Crash or Downturn. KHC has high scores for earnings per share, and gross margin percent. It has low scores for ROE, ROIC, and PEG ratio. A low PEG ratio score indicates that the company may not be experiencing high growth consistently over the past 5 years. In summary, these findings show us that KHC seems to have below average fundamentals because many of the categories show unsatisfactory scores.
Before jumping to conclusions, we’ll have to look closer into individual categories to see what’s going on.
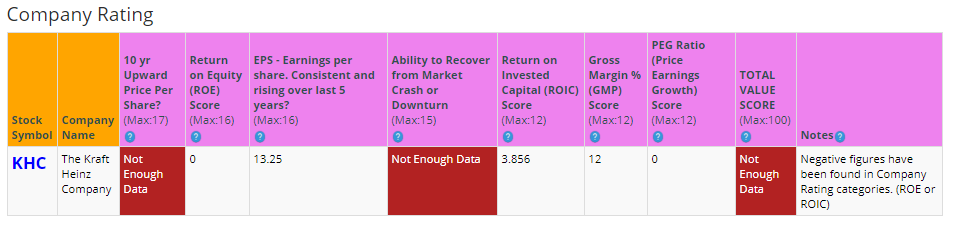
(Source: BTMA Stock Analyzer)
Fundamentals
Let’s examine the price per share history first. In the chart below, we can see that price per share had been growing since 2014 until it reversed trend and has been falling for the past 2 years. Overall, share price average has fallen by about 52.4% over the past 4 years or a compound annual growth rate of -20.38%. This comes to an absolute return of -110.02, which is a terrible return.